 Crypto Venture News One stop Crypto Track Down
Bull trap & bear trap are two forms of the whipsaw pattern describing the movement of the stocks in a volatile cryptocurrency market where the stock out of nowhere switches its direction. These are the unexpected shifts that might offer great losses to the traders if they are not cautious. Thus, you need to understand in detail about the bull trap & bear trap in the bid to mitigate risks while investing.
In this article, we will take you through the concepts of the bull traps and the bear traps with examples and also offer you some important tips so that you can successfully avoid these traps.
What Is A Bull Trap?
A bull trap can be defined as a false signal that an asset such as a stock or the cryptocurrency is bullish. This means that the price is expected to rise and it is a false signal. The traders or the investors are forced to think that this is the best time to invest in an asset as the price will go up in no time. This move actually traps the investors or the traders that acted fast on the buy signal and generates losses on the resulting long positions.
The bull traps are characterized by the purchasing of an asset by the traders or the investors as it breaks through a historically high level of resistance. Several breakouts above the resistance are followed by the continuous higher highs. But a bull trap is characterized by a bearish reversal in no time after the breakout.
How Does A Bull Trap Emerge?
At the beginning of a bull trap, the crypto asset breaks through its resistance level and seems to be on an uptrend. The traders expect that the uptrend will continue bearing increasingly higher highs. This forces them to enter the cryptocurrency market.
Nevertheless, there is an abrupt reversal against this uptrend. This results in the traders who had jumped in to incur losses as the crypto or the stock price declines rapidly. The traders are then compelled to exit the trade with losses or stay trapped in a long position.
Role Of Psychology In Bull Traps
Psychology plays a key role in bull traps. In the first place there is often a desire for the buyers to enter the trade at the very first sign of a price rise. This might make these traders even more susceptible to getting trapped as there is little evidence of an original sustainable move to the upside. They are usually purchasing with a little bit of the evidence of the price to be moving above. However, they are mostly buying depending on the hope as the breakout turns out to be a scam.
The psychology also works when those buyers realize that there are no other buyers that are coming in after them. As the selling commences, the traders who have just invested might panic and sell. This further drives the price down.
The price action is simply the manifestation of the bullish and the bearish actions of the people. While some of these actions rely on the well-researched strategies, experience and statistics, the price action might also be the result of the people that are taking trades depending on the fear of missing out or commonly termed as FOMO, anxiety, greed and the other emotions.
Examples Of A Bull Trap
The following chart depicts a bull trap example.
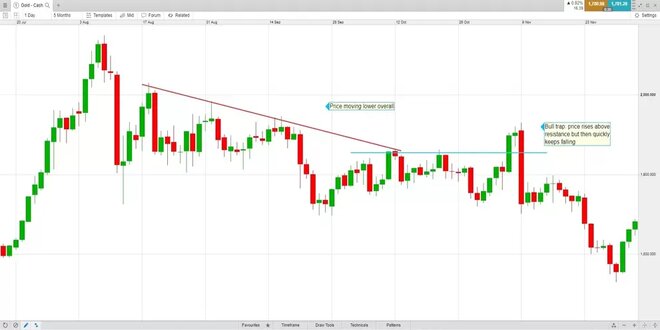
As you can guess, the price was actually rising but then it experienced a strong decline. This is followed by a series of the lower swing highs or the descending red line. A resistance level is created as the price goes sideways for nearly a month as shown in the blue line. The price rises above the resistance line that might attract the buyers hoping that this is the end of the downtrend. In reality, it is not. The price falls quickly and creates a bull trap resuming the downtrend.
The following is another example of a bull trap in the EUR/USD chart:
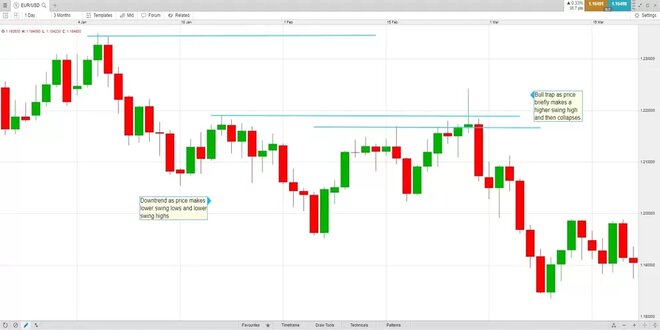
In this bull trap chart, the cryptocurrency pair has entered into a downtrend that has been depicted by a series of the lower swing lows and the lower swing highs. But then after that the price shoots up a prior swing high, bringing the downtrend into question. Those investors who are looking forward to purchase might prefer to jump in but the rise fails quickly and the downtrend continues.
For identifying a bull trap, the traders might watch for a bearish candlestick chart pattern just above the resistance area. A bearish candlestick pattern might indicate that purchasing momentum has slowed and the selling pressure is just coming in. For instance, the shooting star candlestick pattern has aided to set the stage for the decline in the price on the EUR/USD chart.
What Is A Bear Trap?
A bear trap is just the opposite of the bull trap and is defined as a false indication of a reversal from the uptrend into a downtrend. This causes the traders or the investors to open short positions with the anticipation of profiting from the declined price of the asset. Alternatively, it might also cause them to sell off their crypto assets or stocks in the bid to receive profits and prevent the losses. The asset gives up continuing on its uptrend while the bears suffer losses or the opportunity costs.
A technical analyst might mention that the institutional traders attempt to create the bear traps as a method of tempting the retailers or the retail investors for taking long positions. If in this case, the institutional investor becomes successful, and simultaneously the prices shoot up briefly, then it provides the institutional traders with the ability to unload larger stock positions that might otherwise push the prices much downwards.
How Does A Bear Trap Emerge?
The bear traps can be created intentionally by the institutions that push the prices down. This pressurizes the investors and the traders into selling the crypto assets. As soon as the price of the assets decreased, the experienced traders and the institutions jumped back into the cryptocurrency market to purchase the asset at a discount. This leads the price of the asset to rise owing to an increase in the demand.
How Does A Bear Trap Work?
In some of the markets, there might be plenty of investors who are looking to purchase stocks and a few sellers who are ready to accept their bids. In such a case, the buyers may also increase their bid, which is the price that they are ready to pay for the stocks. This is going to attract even more sellers to the cryptocurrency market and the market moves a bit higher owing to the imbalance between the buying and the selling pressure.
Nonetheless, when the stocks are acquired, automatically they become selling pressure on that stock as the investors only receive profits when they sell. Thus, if too many people purchase the stock, it will reduce the purchase pressure and thereby increase the selling pressure.
For increasing the demand and receiving the stock prices to rise, the institutions might push the prices lower making the markets look bearish. This leads the novice investors to sell their stock. As soon as the stock drops, the investors jump back to the market and the stock price increases with the rise in the demand.
Special Considerations On The Bear Trap
A crypto bear trap possesses the capability to prompt a market participant to anticipate a decline in the value of a financial instrument. It also prompts the execution of a short position on the asset . Nevertheless, the value of the asset either stays flat or rallies in the scenario and the participant is forced to suffer a loss.
A bullish trader might sell a declining asset for retaining the profits while a bearish trader might attempt to short that asset for purchasing it back following a price drop to a specific level. If it is the case that the downward trend never occurred or reversed after a brief period, the reversal of the price is identified as a bear trap.
The market participants mostly rely on the technical patterns for analyzing the market trends and for the evaluation of the investment strategies. The technical traders attempt to identify the bear traps and avoid them by making use of a variety of analytical tools including the Fibonacci retracements, the volume indicators and the relative strength oscillators. These tools can help the investors to understand and predict if the current price trend of a given security is legit and sustainable.
Identifying & Avoiding Bull Trap & Bear Trap
The bull trap and bear trap are quite challenging to identify by nature as they move against the expectations and the typical price trends. Nevertheless, by conducting the careful technical analysis and the fundamental analysis on the assets, the traders are able to identify as well as avoid the potential bull trap and bear trap. Below mentioned are some of the technical indicators and methods that you can use if you want to know how to identify bull trap and bear trap.
Use The Relative Strength Index (RSI)
One of the ways to identify a potential bull trap or a bear trap is by calculating the relative strength index or the RSI of an asset. This technical indicator permits you to check if the cryptocurrency asset or the stock is underbought, overbought or neither.
The RSI is an oscillator measuring the magnitude and the speed of the recent price changes. The following is the formula for calculating the RSI:
RSI = 100 – (100 / (1 + (average gains at closing/average losses at closing)))
Usually, this is calculated over a period of 14 days or two weeks, even if it can be applied to the other periods as well. The period never matters in the formula as it is canceled out in the calculation.
For instance, if XYZ cryptocurrency possesses an average gain of 5% and an average loss of 10% at a closing over a period of 14 days, then the RSI would be calculated in the following method:
RSI = 100 – (100 / (1 + 2 / 5))
= 100 – 71.4
= 28.6
The RSI serves as a figure between 0 and 100. An asset bearing an RSI of around 70 and above is considered to be overbought that indicates a potential bearish reversal owing to profit taking. On the contrary, an RSI of 30 and below will refer to it being oversold meaning that it is likely to rise in price. Thus, it can be stated that a high RSI might be considered as a warning signal of either a potential bull trap or bear trap.
Bull Trap With A High RSI
In case of a potential bull trap bearing a high RSI and overbought conditions indicates that there is mounting selling pressure. The traders are looking forward to taking their profits and are seemingly to exit the trade very soon. As such, the initial breakout and the uptrend might not be the indicative of continuing price increases. Instead, the price of the asset is likely to decline as soon as these traders start to sell the asset.
Bear Trap With A High RSI
A high RSI and the overbought condition together might also mean high selling pressure in case of the potential bear trap. In such cases, the institutions might encourage selling off the asset by driving the prices lower. This is to reduce the mounting selling pressure and to re-enter at the lower prices for the better price positions. The influx in the purchase demand at this point is sure to drive the prices back up.
In such cases, the initial downward trend is not indicative of the continuous price decrease as it is a temporary dip that has been caused by the profit-taking and the institutional manipulations. In place of this, the price will shoot up again as soon as the institutions scoop the available crypto assets. Therefore, a high RSI can also be indicative of a potential bear trap.
Use The Volume Indicators
Volume is considered to be another important indicator for looking out for in both the bull trap and bear trap. Trading volume needs to be higher than the average for indicating momentum and mounting the pressure for either a strong uptrend or the market swings and the reversals. Thus, the low trading volume is a warning sign of the potential bull and the bear traps.
Use The Candlestick Patterns
The bullish candlestick patterns like the bullish engulfing patterns, tweezer bottom, the piercing pattern or the morning star. These are some of the good signals that the crypto market is truly going in an uptrend and that it is not a bull trap.
The very strong candlestick patterns that you need to look out for include the evening star, bearish engulfing and the three black crows. These bearish signs aid in providing confirmation that the prices will keep on declining and this is not the case of the bear trap.
On the contrary, indecisive candlesticks like the doji candlestick pattern might also warn of a bear trap or a bull trap. This is owing to a fact that a doji star candlestick pattern signifies the tension and the indecision between the sellers and the buyers that causes the opening and closing price to be the exact same.
Like always, you need to be extremely careful in studying these candlestick patterns in the wider context of the market trends. These candlestick patterns must not be relied upon in isolation to determine if the uptrend will continue or take a reverse. Possessing a strong foundation in technical analysis will enable you to understand the meaning of these candlestick patterns in the context of the market and trade them with efficiency.
How To Escape A Bull Trap?
The best possible way to escape a bull trap is by setting a stop loss on your position as you open it. This will aid you to prevent heavy losses in case you are caught in a bull trap.
There are a couple of stop loss kinds to choose from. This includes the training, guaranteed and standard. When you are trying to avoid a bull trap, a trailing stop might prove to be most helpful as it will trail behind the current market value by a predefined amount of points. This will auto close your position in case the market value falls by that set amount.
This would also aid you to lock in much more profit as possible and also cut down the losses early on into a bull trap.
Bull Trap Vs. Bear Trap: How Are They Both Different?
While a crypto bull trap aims to trap the buyers in a losing trade, on the contrary, the bear trap aims to trap the sellers or the short sellers in a losing trade.
Typically, a bear trap occurs during an overall uptrend. The price of the asset might experience a short-time decline that drops below a support level, alluring the people to sell the existing long positions or take the short positions. If there remain not enough sellers for keeping the downward momentum going on, then the buyers might step in and drive the price higher.
Those who have shorted can become trapped in a losing trade and must purchase to exit. Those who sold might experience regret for selling and wishing to purchase again, driving the prices higher.
The below chart depicts a bear trap example that had occurred in the US SPX 500 instrument:
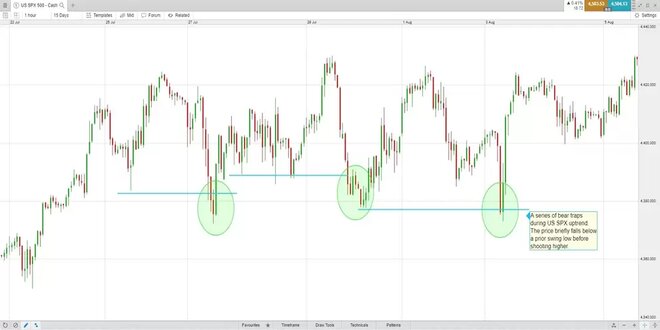
The triangle patterns in the above bear trap chart might occur when the price of an asset moves within a smaller price area over time. This forms a triangle-like appearance on the chart. The traders might watch for the breakouts from these patterns. The rounded tops and the bottoms refers to an end of an uptrend or downtrend respectively. A rounded top happens when the price accent slows down and starts to move sideways or makes very little progress to the upside and then starts to move lower. A rounded bottom is similar and happens after a decline. The rounded bottom resembles a saucer.
Bear Trap Vs. Short Selling: The Relation
A bear is a trader or an investor in the financial markets that believes that the price of a security is likely to decline. Bears might also believe that the overall direction of a financial market might be in decline. A bearish investment strategy can profit from the decline in the asset price and a short position is mostly executed for implementing this strategy.
A short position is termed as a trading technique that borrows the contracts or shares of an asset from a broker via a margin account. The traders or the investors sell those borrowed instruments for buying them back when the price drops. This books a profit from the decline. When a bearish investor incorrectly identifies the decline in the price, it increases the risk of getting into a bear trap.
The short sellers are forced to cover the positions as prices shoot up to minimize the losses. A subsequent increase in the purchase activity might initiate further upside that can continue to fuel the price momentum. Following the short sellers purchase, the instruments that are required to cover their short positions, the upward momentum of the asset all tends to go down.
The risks of the short seller includes maximizing the loss or even triggering a margin call when the index value or the stock rises continuously. An investor can also minimize the damage from the traps by using the various kinds of stop losses when executing the market orders. In later articles, we will discuss bull trap trading and bear trap trading.
The Closure
The bull trap & bear trap are two common terms that are widely common in the cryptocurrency space. A bull trap is a reversal occurring from an upward trend sooner an asset breaks through a historical level of the resistance. The bear markets and the steep sell-offs often have been followed by the temporary rallies that turn out to be a bull trap. The investors or the traders can monitor the trading volume and the other indicators for helping to avoid getting trapped in a bull or a bear trap.
Frequently Asked Questions
1. What is the difference: bull trap vs dead cat bounce?
A dead cat bounce is generally termed when there is an upward price movement occurring during a strong downtrend. Usually, a bull trap involves some technical elements like the price moving upwards above a prior resistance level. This is what creates the trap. A dead cat bounce might exhibit similar characteristics to a bull trap.
2. Is a bull trap bullish or bearish?
A bull trap is a short-term bullish yet longer-term bearish. The bull trap lures the buyers creating a very short-term rise in the price of an asset. Eventually, this gives a rise to selling pressure and a falling price.
3. How to manage risk if caught in a bull trap?
To manage the risk when trading in a bull trap, you might have to consider the use of the stop loss orders. This order will close the trade if a specific amount of money is lost or a specific price level is reached. Additionally, you have to consider the position size. The larger position sizes bear the greater risk and profit potential than the smaller ones.
- The Bitcoin Wallet Boom: Why Demand Is Skyrocketing - 25/11/2023
- How To Choose The Best Crypto Exchange Affiliate Programs - 03/03/2023
- Crypto License: How To Get It Now? - 03/02/2023