ethereum-price-analysis
Ethereum Price Analysis

Ethereum Price Below $1,300, MA Meter Suggests ‘Strong Sell’

Ethereum (ETH), the second-largest cryptocurrency in the world, has been suffering due to the recent crypto market meltdown. The Ethereum price was in the ‘green’ at the time of writing but that does not change the fact that it extended below the $1,300 mark due to the recent bearish sessions. Moreover, when we got our eyes on ETH, the crypto was gaining but slightly.

Ethereum Price Today

According to the data by CoinMarketCap, a leading price-tracking website for crypto, the Ethereum price today was up by 0.99% as ETH traded at $1,297.95 at the time of reporting this article on Wednesday, October 12, 2022. The market capitalization of the ETH token was $159.34 billion, gaining 1.02%. However, the 24-hour trade volume slumped by 16.06% and stood at $8.13 billion.

ethereum-1d-graph-price-analysis
Ethereum (ETH) 1D Graph (Source: CoinmarketCap)


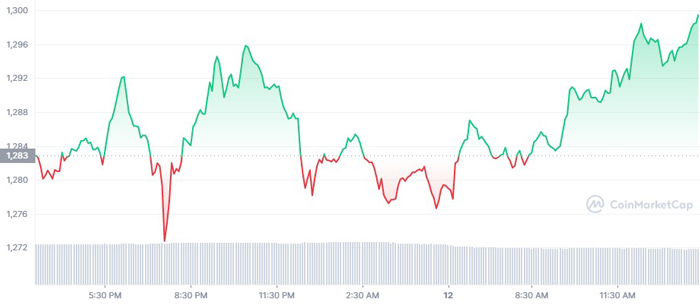
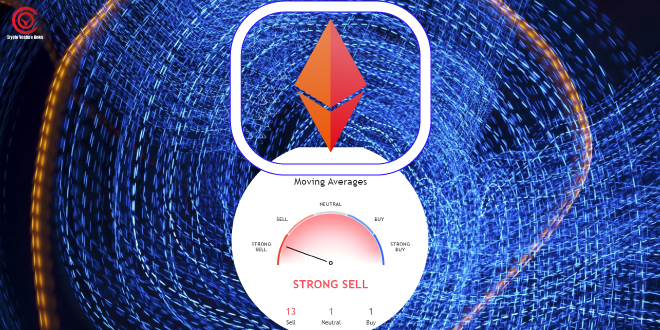
The day’s high was also not above $1,300 and had been recorded at $1,298.68. Though the crypto’s price was in the ‘green’ the rebound it saw was not significant enough. This is why the technical analysis data from TradingView was disappointing. Moreover, due to repeated ‘red’ sessions even the Ethereum price prediction rating has been lowered to a maximum of $1,563.79 by the end of this year.

Technical Analysis For ETH By TradingView

The Summary provided by TradingView indicates that the Ethereum crypto is a ‘sell’ currently with 13 indicators suggesting a buy, 9 indicating that it’s a ‘hold’ (neutral), and just 4 pointing toward a ‘buy’ action. The Moving Averages data even suggested worse. The MA meter under TradingView technical analysis indicated that Ethereum is a ‘Strong Sell’ today with 13 metrics supporting that. 

The 50-day Exponential Moving Average (EMA) stood at 1426.58, indicating an action of sell. In addition, the 50-day Simple Moving Average was $1454.92 pointing towards a sell. The current ETH price is far below these moving average metrics. Therefore, the price trend is downwards and can be considered a sell.

However, due to the frequent price fluctuations and recent recovery sessions, the oscillator metrics provided by the site indicate that Ethereum is a ‘buy’ (neutral) currently. According to the statistics, 8 out of 10 indicators count for neutral investment action. The Relative Strength Index was at 40.94, suggesting that no trading actions should be undertaken. Moreover, the Commodity Channel Index was at -117.40, pointing to a ‘buy’.

To answer the question of whether Ethereum is a buy or not, it would be right to conduct a careful study of both indicator metrics and market trends. Both these strong meters suggest that Ethereum is a sell or hold. Therefore, buying is definitely not an option currently since the Ethereum price is trading below $1,300. However, it is advised to do detailed research before making any trading action.

Check Also

new-mining-strategies-crypto-halving

New Mining Strategies You Need To Incorporate After Crypto Halving

Good News! The Bitcoin network has already crossed its 800,000th block at the end of …

Leave a Reply

Your email address will not be published. Required fields are marked *